Large Cap vs Mid Cap vs Small Cap MF: Which Equity Category Fits Your Risk Profile?
Large cap, mid cap or small cap - which equity mutual fund category fits your risk profile and goal? This definitive 2026 guide gives you the framework, data, and decision rules to choose correctly.
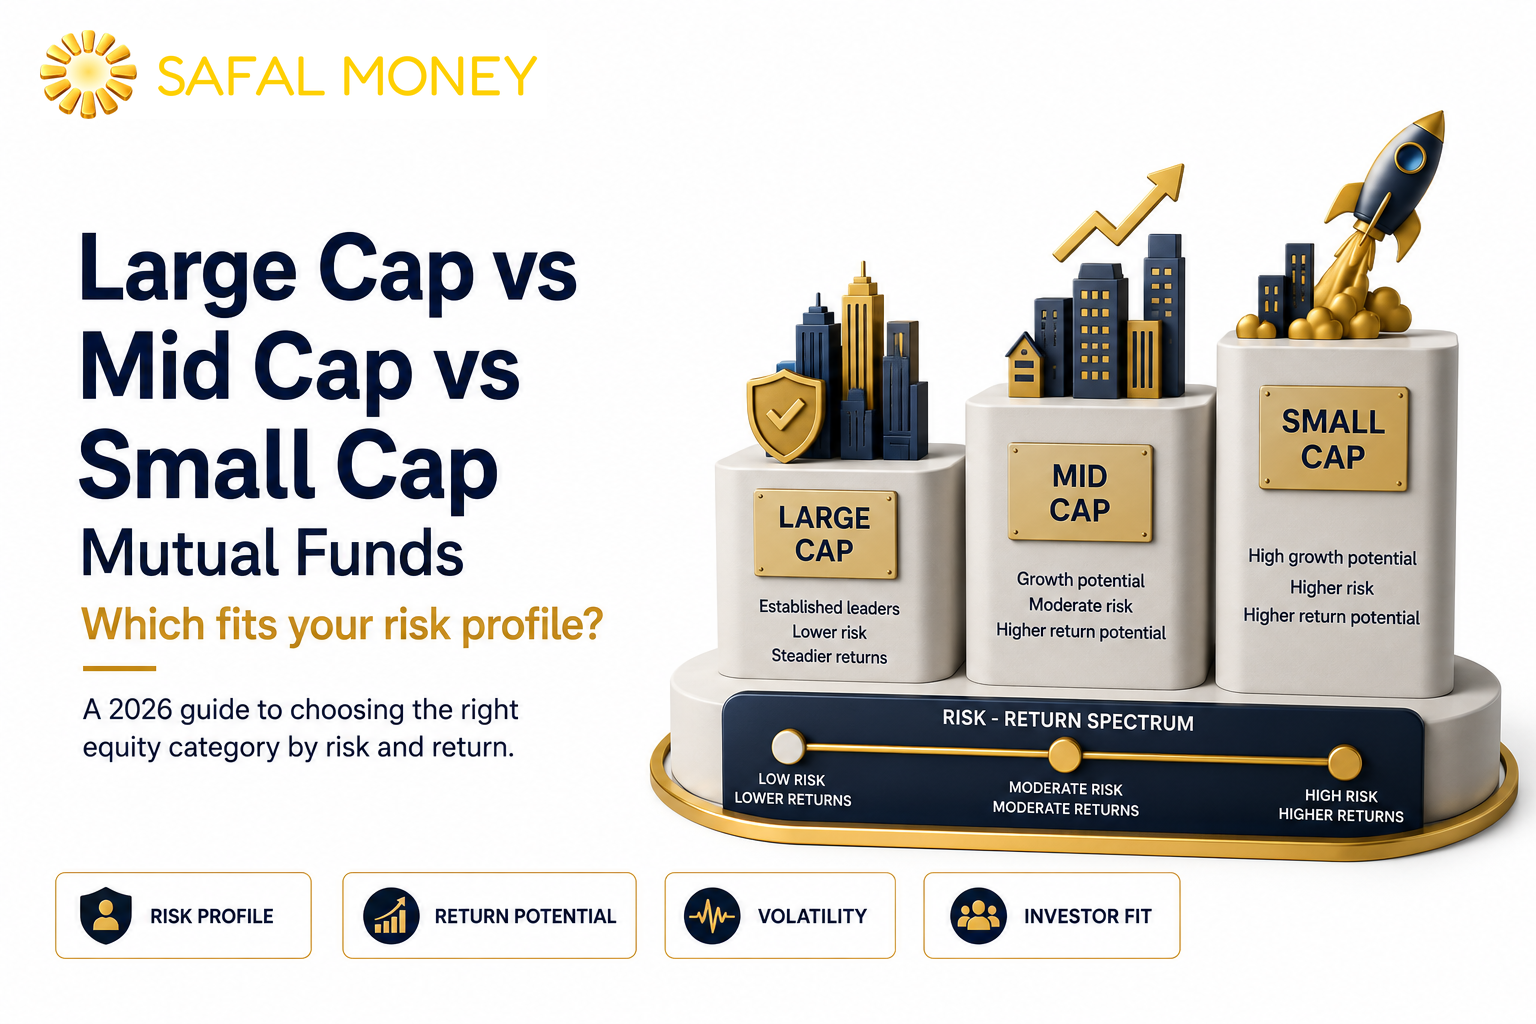
Walk into any conversation about equity mutual funds in India and within five minutes, someone will ask: "Should I go large cap, mid cap, or small cap?"
It sounds like a simple question. It is not. The answer depends on your investment horizon, your genuine risk tolerance — not what you think it is, but what it actually is when your portfolio falls 40% — your existing portfolio composition, and where we are in the market cycle.
This guide gives you the complete framework — the facts, the numbers, the risk profiles, and the decision rules — to answer this question correctly for your specific situation. We also cover what most guides miss: how these three categories interact with each other, how to size each within a portfolio, and where SIF fits as a fourth layer that transcends the long-only limitation all three share.
How Does SEBI Define Large Cap, Mid Cap and Small Cap? The Exact Boundaries
Before comparing performance and risk, it is essential to understand exactly what each category means under SEBI's framework. These are not approximate labels — they are precise regulatory definitions.
- Large Cap: Companies ranked 1 to 100 by full market capitalisation on Indian stock exchanges. Large cap funds must invest at least 80% of their assets in these companies. As of mid-2026, the large cap universe includes companies with market capitalisation approximately above ₹50,000–60,000 crore — India's biggest, most liquid, most researched businesses.
- Mid Cap: Companies ranked 101 to 250 by full market capitalisation. Mid cap funds must invest at least 65% of their assets in these companies. The mid cap universe currently spans roughly ₹18,000 crore to ₹50,000 crore market capitalisation — established businesses with significant growth runway.
- Small Cap: Companies ranked 251 and beyond by full market capitalisation. Small cap funds must invest at least 65% of their assets in these companies. Everything below approximately ₹18,000 crore market cap falls in this universe — over 4,000 listed companies, most of them under-researched and inefficiently priced.
These definitions matter for two reasons. First, they ensure genuine category purity — a large cap fund cannot quietly shift to mid caps when large caps are expensive. Second, they make within-category comparison meaningful — two large cap funds are genuinely comparable because they follow the same mandate.
The Core Difference: Why Size Determines Risk and Return Profile
The relationship between company size and investment risk is not arbitrary — it reflects real economic dynamics.
Large companies are large because they have survived and scaled. They have established business models, professional management, access to capital, diversified revenue streams, and typically strong competitive positions. They are also heavily covered by analysts — hundreds of research reports are published on Reliance or HDFC Bank every year. This heavy coverage means information is rapidly priced in — it is very difficult for a fund manager to have an informational edge in the large cap space.
Mid cap companies are past the startup phase but still growing rapidly. They have proven their business model but have significant market share to capture ahead. They are less researched than large caps — a skilled mid cap fund manager can genuinely identify opportunities that the market has not yet fully priced in. But they are also more vulnerable to economic slowdowns, more dependent on key individuals, and less able to weather prolonged adversity.
Small cap companies are the most diverse group — thousands of businesses ranging from genuinely exciting growth stories to zombie companies that should not be publicly listed. The information asymmetry is highest here — many small cap stocks are covered by zero or one analyst. A fund manager with deep research capabilities can find extraordinary opportunities. But governance risk, liquidity risk, and business risk are all significantly elevated.
The Historical Return Picture: What the Data Says
Based on long-term historical data for Indian markets — this is past performance, not a guarantee or projection of future returns:
Over rolling 10-year periods, small cap funds have on average generated higher absolute returns than mid cap funds, which have generated higher returns than large cap funds. This is consistent with the higher risk premium that smaller, less liquid companies must offer to attract investor capital.
However — and this is the critical nuance — the distribution of outcomes is vastly different across categories:
- In a strong bull market (2003–2007, 2014–2017, 2021–2024 phases), small cap funds can return 3–5x more than large cap funds over 3–5 year periods.
- In a sharp bear market (2008, 2020, 2022 corrections), small cap funds fall significantly more than large caps — sometimes 50–65% against large cap falls of 30–40%.
- In the recovery phase after a correction, small caps typically recover faster and further — but only for investors who stayed invested through the bottom.
The key insight from the data: small cap outperformance over long periods is real, but it is not smooth or predictable. It requires an investor who can stay invested through severe drawdowns without selling — which is psychologically far harder than it sounds.
Deep Dive: Large Cap Funds — Stability, Efficiency, and the Index Fund Question
What Large Cap Funds Are Best At
Large cap funds provide the stable equity core of any well-constructed portfolio. Their defining characteristics:
- Lower volatility than mid and small cap funds — typically standard deviation of 15–20% versus 20–28% for mid cap and 25–35% for small cap.
- Faster recovery from corrections — large, well-capitalised companies have the balance sheet strength to weather downturns and recover quickly when sentiment turns.
- Superior liquidity — the fund manager can buy and sell large cap stocks with minimal market impact, even in large portfolios. This makes large cap funds suitable for very large AUM without the performance drag that affects mid and small cap funds at scale.
The Active vs Passive Dilemma in Large Caps
Here is the uncomfortable truth about large cap active funds in India: the majority of them underperform their benchmark (Nifty 50 or Nifty 100) over 5 and 10-year periods, after accounting for expense ratios. This is consistent with SPIVA India data published annually.
The reason is market efficiency. The Nifty 50 is covered by thousands of analysts globally. By the time a fund manager identifies a mispricing, it has typically already been corrected. The expense ratio of an active large cap fund — typically 0.8–1.5% for direct plans — creates a permanent headwind that most managers cannot consistently overcome.
This creates a genuine dilemma: should you use an active large cap fund or a Nifty 50 index fund?
SafalMoney's view: for most HNI investors, a Nifty 50 or Nifty 100 index fund at 0.1–0.2% expense ratio should form the core of their large cap allocation. Active large cap funds can coexist as a satellite — but only if the fund has a demonstrably consistent track record of outperforming its benchmark over multiple full market cycles, not just the last 1–2 years.
Who Should Use Large Cap Funds
Ideal for investors who prioritise stability over maximum return, those who are 50+ and approaching retirement, conservative-to-moderate risk investors building their first equity portfolio, and as the core anchor (40–50% of equity allocation) within a larger diversified portfolio.
Deep Dive: Mid Cap Funds — India's Growth Engine at Moderate Risk
Why Mid Cap Is Where India's Growth Story Lives
If you believe in India's long-term growth story — and the structural case for India's economic expansion over the next 20 years is compelling — the mid cap segment is where much of that story will play out.
Mid cap companies are at the most dynamic stage of their business lifecycle. They have validated their model, established their market position, and are now in the high-growth phase of scaling from ₹20,000 crore to ₹1,00,000 crore market cap. This graduation from mid cap to large cap is how enormous wealth is created for long-term investors.
India has produced dozens of such stories over the past two decades — companies that were mid caps in 2005 and are now among India's largest businesses. The next generation of such companies exists in today's mid cap universe.
The AUM Problem in Mid Cap Funds
The single biggest risk in mid cap investing is not market risk — it is AUM bloat. When a mid cap fund becomes popular and attracts large inflows, its AUM can grow to ₹25,000–50,000 crore or more. At this scale, deploying capital meaningfully in mid cap stocks without moving prices becomes extremely challenging.
A mid cap fund with ₹50,000 crore AUM wanting to put 2% of its portfolio into a ₹5,000 crore market cap company would need to own 20% of the entire company — which is impractical, would move the stock price significantly during buying, and would be impossible to sell quickly if the thesis changes.
This is why several of India's most respected mid cap funds have periodically closed to fresh investment when their AUM grew beyond their capacity to deploy effectively. A fund that closes to protect performance quality is demonstrating better investor alignment than one that keeps accepting money regardless of AUM.
Before investing in any mid cap fund, check the AUM. Above ₹20,000–25,000 crore, scrutinise the portfolio carefully — are they genuinely invested in mid caps or have they drifted toward large caps out of necessity?
Who Should Use Mid Cap Funds
Ideal for investors with a genuine 7–10 year horizon, moderate-to-high risk tolerance, and a core large cap or index fund already in place. Mid cap should typically not exceed 25–30% of total equity allocation. First-time investors should start with large cap or flexi cap before adding mid cap exposure.
Deep Dive: Small Cap Funds — Maximum Potential, Maximum Patience Required
The Small Cap Opportunity — Why It Is Real
The small cap universe in India is genuinely inefficient. With over 4,000 listed small cap companies and limited analyst coverage, information asymmetry is high. A skilled small cap fund manager with deep research capabilities — visiting companies, talking to suppliers and customers, understanding local market dynamics — can consistently find businesses that the market has undervalued.
Historically, well-managed small cap funds in India have delivered returns that are 2–4% per year higher than large cap funds over full 10-year cycles — based on past data, not a projection. This difference compounds dramatically over long periods.
On a ₹10 lakh investment: the difference between 14% and 18% annual return over 15 years is approximately ₹1.5 crore. This illustrates why the small cap premium — if captured by a skilled fund manager — is worth understanding even for conservative investors who choose not to invest in it.
The Small Cap Reality — What Most Guides Do Not Tell You
Read This Before You Invest in Small Cap
The small cap return premium comes with conditions attached that most investors significantly underestimate:
- You must tolerate 50–65% drawdowns without selling. In the 2008 global financial crisis, many small cap funds fell 70–80% from peak to trough. In the 2020 COVID crash, small cap funds fell 45–60% in weeks. Investors who sold during these drawdowns did not capture the small cap premium — they crystallised losses at the worst possible time.
- You need a 10-year minimum horizon — not 7, not 8, not "around 10." Recovery from a major small cap correction can take 3–5 years. If you need to access your money 6 years into a 10-year small cap investment while the fund is still in a recovery phase, you may be forced to exit at a loss.
- Small cap must be a satellite, not a core. The maximum sensible small cap allocation for most HNI investors is 10–15% of total equity, or 7–10% of total portfolio. At this sizing, a 60% drawdown in the small cap fund reduces total portfolio value by 4–6% — painful but survivable. If small cap is 40% of your portfolio and falls 60%, your total portfolio falls 24% — a different, more damaging proposition.
- Liquidity is the risk that does not show up in returns data. Small cap stocks are significantly less liquid than large cap stocks. In a sharp market selloff, fund managers may be unable to sell small cap positions quickly without significantly moving prices. This is why many small cap funds have gating provisions or temporarily suspend redemptions during extreme market stress — something large cap and mid cap funds rarely need to do.
Who Should Use Small Cap Funds
Ideal for aggressive investors aged 25–42 with 10+ year horizons, strong psychological resilience through market downturns, and a core portfolio of large cap and mid cap funds already in place. Maximum 10–15% of equity allocation. Not suitable for first-time equity investors, those approaching retirement, or anyone who will need the money in under 8 years.
How Do These Three Categories Perform Differently Through Market Cycles?
Understanding cycle behaviour is as important as understanding average returns. Here is how the three categories typically perform in different market environments:
| Market Environment | Large Cap | Mid Cap | Small Cap |
|---|---|---|---|
| Bull market (strong, sustained) | Solid gains but lags mid/small | Outperforms significantly | Outperforms most dramatically |
| Sideways market (low volatility) | Best performer — defensive characteristics | Moderate | Often underperforms |
| Correction (10–20% market fall) | Falls least; recovers fastest | Falls more; recovers well | Falls most; recovery varies |
| Bear market (30%+ fall) | Defensive; better capital preservation | Significant losses | Maximum drawdown |
| Early recovery (post-correction) | Recovers steadily | Recovers strongly | Can recover explosively if correction was panic-driven |
The 2026 context is particularly instructive. The Iran-US conflict created a sharp, geopolitically-driven market correction in February–April 2026. In this kind of sudden, sentiment-driven correction — rather than a fundamentally driven bear market — small cap stocks often fall more sharply than fundamentals justify, creating attractive entry points for investors with long horizons. The subsequent recovery, as geopolitical fears ease, tends to be strong in the small cap segment.
This is not a recommendation to buy small cap funds in July 2026 — it is a structural observation about how the category typically behaves through geopolitically-driven corrections.
The Portfolio Sizing Framework: How Much of Each?
Here is SafalMoney's recommended equity allocation framework across the three categories, by investor profile:
| Investor Profile | Large Cap / Index | Mid Cap | Small Cap | Notes |
|---|---|---|---|---|
| Conservative (50+, capital preservation) | 70–80% | 15–20% | 0–5% | Core stability; limit small cap |
| Moderate (35–50, balanced growth) | 45–55% | 25–30% | 10–15% | Balance of stability and growth |
| Aggressive (25–38, maximum growth) | 30–40% | 30–35% | 20–25% | Growth-oriented; long horizon required |
| FIRE accumulator (25–35, 15yr horizon) | 25–35% | 30–35% | 20–25% | Maximum growth with SIF layer added |
Note: these are allocations within the equity portion of the portfolio — not the total portfolio. The total portfolio also includes debt, gold, international funds, and potentially SIF.
The One Question That Determines Your Category Mix
If there is a single question that cuts through all the analysis and gives you the right category mix for your situation, it is this:
"What would I actually do if my portfolio fell 40% from today's value and had not recovered after 2 years?"
If your honest answer is "I would stay invested and possibly add more" — you are genuinely suited for a meaningful mid cap and small cap allocation. Your risk tolerance matches the category's risk profile.
If your honest answer is "I would be very worried but would try to hold on" — a moderate mid cap allocation (20–25% of equity) is appropriate, but small cap should be minimal.
If your honest answer is "I would probably sell to stop further losses" — large cap and index funds should dominate your equity allocation. This is not a failure of character — it is an honest self-assessment that will protect you from making expensive mistakes.
Most investors overestimate their risk tolerance in calm markets and discover their true tolerance during corrections. Investors who have experienced the 2008 crash, the 2020 COVID selloff, or the 2026 Iran war correction firsthand have a significant advantage — they actually know how they behave under pressure.
Where Does SIF Fit? The Fourth Layer That All Three Categories Are Missing
Large cap, mid cap, and small cap funds share one fundamental limitation: they are all long-only. In a falling market, every category falls. In a flat market, every category delivers near-zero returns. There is no mechanism within any of these categories to profit from declining stocks or hedge against market-wide drawdowns.
SIF — Specialised Investment Fund adds this capability. Through a long-short structure using equity derivatives, SIF fund managers can simultaneously hold long positions in companies expected to outperform across any market cap segment and short positions in companies expected to underperform. The result is a return stream that is less correlated to pure market direction than any of the three traditional categories.
For a well-constructed HNI portfolio, SIF does not replace large cap, mid cap, or small cap funds. It complements them — providing the uncorrelated return layer that makes the overall portfolio more resilient across different market environments.
The specific combination that makes sense for you depends on your SafalScore™. Use SafalZenith to calculate your ideal SIF allocation alongside your existing equity fund framework, and SafalCheck™ to evaluate which SIF strategies best complement your large cap, mid cap, and small cap mix.
Free tool, no login required
Frequently Asked Questions
Which is better, large cap, mid cap or small cap mutual fund?
None is universally better - each category serves a different purpose and suits a different investor profile. Large cap funds provide stability, liquidity, and lower volatility, ideal as the core of any equity portfolio. Mid cap funds offer higher growth potential with moderate additional risk, ideal for investors with 7-10 year horizons as a satellite to a large cap core. Small cap funds offer the highest long-term return potential with the highest risk and volatility, appropriate only for aggressive investors with 10+ year horizons as a small satellite allocation. Most investors benefit from a combination of all three, sized according to their risk profile and horizon.
How does SEBI define large cap, mid cap and small cap?
SEBI defines large cap as the top 100 companies by full market capitalisation, mid cap as companies ranked 101-250 by market capitalisation, and small cap as companies ranked 251 and beyond. Large cap funds must invest at least 80% in large cap stocks. Mid cap and small cap funds must each invest at least 65% in their respective categories. These definitions are precise regulatory mandates, not approximate labels, and are recalibrated periodically by SEBI based on updated market capitalisation rankings.
Can a small cap fund lose all my money?
A small cap fund cannot go to zero - even in the worst scenario, the fund holds a diversified portfolio of dozens of stocks, and the probability of all of them going to zero simultaneously is essentially nil. However, small cap funds can and do experience severe drawdowns - falls of 50-65% in major bear markets are not unusual based on historical data. These drawdowns are typically temporary for diversified funds - patient investors who stayed invested through past corrections have eventually recovered and gone on to generate strong returns. The risk is not permanent capital loss through a diversified fund but rather the risk of being forced to sell during a drawdown due to cash needs or psychological pressure.
Is a Nifty 50 index fund better than an active large cap fund?
For most investors over most time periods, yes, based on historical data. The majority of actively managed large cap funds in India have underperformed the Nifty 50 index over 5 and 10-year periods after accounting for expense ratios, according to SPIVA India data. The primary reason is the high efficiency of the large cap market - it is very difficult for active managers to generate consistent alpha over a heavily researched index. A Nifty 50 direct plan index fund at 0.1% expense ratio is difficult to beat consistently over long periods. Active large cap funds can be justified only when the fund has a demonstrably strong long-term track record of meaningful outperformance over multiple full market cycles.
What percentage of my portfolio should be in small cap funds?
For most investors, small cap should not exceed 10-15% of the equity portion of the portfolio, or 7-10% of the total portfolio including debt. This sizing ensures that even a severe small cap drawdown (50-65%) reduces total portfolio value by only 4-7% - painful but survivable and recoverable. Investors who put 30-40% of their total portfolio in small cap funds are taking concentrated exposure to the highest-risk equity category, which is only appropriate for very aggressive investors with 10+ year horizons, full awareness of drawdown risk, and the psychological resilience to stay invested through severe corrections.
Last updated: 6 July 2026